I have an AEA PK-232 that I picked up a couple of years ago at my Amateur Radio club’s White Elephant sale for a few bucks. With the VT132 that I just recently built, it works as an excellent terminal client to the PK-232.
To connect, set baud rate in the VT132 to 1200 8N1. Connect with a null modem cable. Power on the PK-232 and you should see:
Press type a star (*) for auto-baud routine.
Press * and then you should see the AEA PK-232 startup copyright message.
To get a cmd: prompt to enter commands, press Ctrl-C.
I’ve attached my 2m radio with the audio in so far, and here’s a pic while decoding some APRS messages:
Next I need to make a custom cable to connect to my Icom’s data port, and then I should be all set to work some packet.
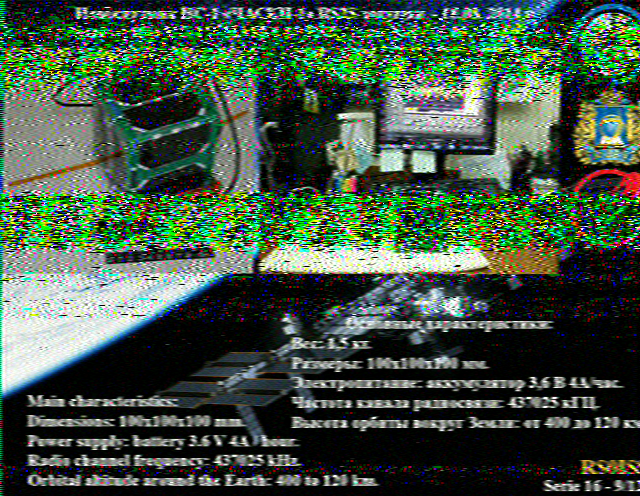
The ISS has been transmitting images using SSTV on 2m Amateur Radio for the last couple of days. Here’s a couple of my decodes from yesterday (10/7/20)
1959PST 10/7/20:
1822PST 10/7/20 – this was a low angle pass, so surprised I could receive any from this pass:
I completed some of my planned updates recently, in particular moving the AngularJS static content to AWS S3 to serve as a static website, and then also updated AWS Route 53 to point www.spotviz.info to the S3 bucket for this front end content, and then api.spotviz.info is pointing to a VPS running the REST backend. At the same time moving the frontend to S3, I also spent a crazy amount of time migrating to use Webpack to build the frontend, which I covered here.
I’ve now started to pick up some enhancements to the app. The first enhancement is to add a new heatmap to show spots per hour, as a drilldown feature from the heatmap per day. What surprised me at this point is how crazy the original MongoDB query looks now it’s been a couple of years since I was last playing with this. Luckily the update to do counts per hour is only a minor change from the counts per day, so should have that complete soon.
Following on from Part 1 and subsequent posts, I now have the app deployed locally on WildFly 17, up and running, and also redeployed to a small 1 cpu 1 GB VPS: http://www.spotviz.info . At this point I’m starting to think about how I’m going to redesign the system to take advantage of the cloud.
Here are my re-design and deployment goals:
monthly runtime costs since this is a hobby project should be low. Less that $5 a month is my goal
take advantage of AWS services as much as possible, but only where use of those services still meet my monthly cost goal
if there are AWS free tier options that make sense to take advantage of, favor these services if they help keep costs down
Here’s a refresher on my diagram showing how the project was previously structured and deployed:
As of September 2019, the original app is now redeployed as a monolithic single .war again to WildFly 17, running on a single VPS. MongoDB is also running on the same VPS. The web app is up at: http://www.spotviz.info
There’s many options for how I could redesign and rebuild parts of this to take advantage of the cloud. Here’s the various parts that could either be redesigned, and/or split into separate deployments:
WSJT-X log file parser and uploader client app (the only part that probably won’t change, other than being updated to support the latest WSJT-X log file format)
Front end webapp: AngularJS static website assets
JAX-WS endpoint for uploading spots for processing
MDB for processing the upload queue
HamQTH api webservice client for looking up callsign info
MongoDB for storing parsed spots, callsigns, locations
Rest API used by AngularJS frontend app for querying spot data
Here’s a number of options that I’m going to investigate:
Option 1: redeploy the whole .war unchanged as previously deployed to OpenShift back in 2015, to a VM somewhere in the cloud. Cheapest options would be to a VPS. AWS LightSail VPS options are still not as a cheap as VPS deals you can get elsewhere (check LowEndBox for deals), and AWS EC2 instances running 24×7 are more expensive (still cheap, but not as cheap as VPS deals)
Update September 2019: COMPLETE: original app is now deployed and up and running
Option 2: Using AWS services: If I split the app into individual parts I can incrementally take on one or more of these options: